GA4 for SEO: The 8 Reports That Matter
Skip the 60-card explorations and read these eight

GA4 has more reports than any SEO needs and fewer of the right defaults than any SEO would design. Universal Analytics retired July 1 2023, so the disagreement is academic — you're using GA4 whether you like it or not. The question is which of its 80+ pre-built reports and explorations actually answer the questions an SEO asks every week, and which ones are noise.
The honest answer: eight reports do the job. The other 72 are useful situationally, redundant, or actively misleading because of data thresholding and sampling. This article walks the eight, in the order an SEO investigation usually moves: from "is my organic channel up or down" to "which page caused it" to "did the visitors do what we wanted." Each section calls out the GA4 quirks (event-based sessions, thresholding, the engagement-rate inversion) that bite when you treat GA4 numbers like UA numbers.
If you're new to the platform, the broader measurement context lives in the SEO Analytics Stack pillar. If you already have GA4 wired in and just want to know what to open Monday morning, this is that list.
Report 1: Traffic Acquisition (Acquisition > Traffic acquisition)
The default landing for any "how is organic doing" question. The Default Channel Group dimension splits traffic into Organic Search, Direct, Referral, Paid Search, and so on, with rows for each.
What to set up the first time you open it:
- Add Session source / medium as a secondary dimension. Default Channel Group is a coarse rollup. For organic specifically, you want to see whether the volume is google / organic, bing / organic, or scraped into the Organic bucket from a missclassified referrer.
- Pin Engaged sessions and Engagement rate. Sessions alone hide quality. A 20% sessions rise that comes with a 30% engagement-rate drop is a content-quality regression dressed up as growth.
- Filter to Organic Search and save the view. GA4 doesn't persist filter state by default. Save the report or build it in Explorations to make it your homepage.
The data thresholding trap: GA4 applies a privacy threshold when reports include user-level dimensions (like User ID, demographics, Google Signals data). When your report contains those dimensions and the row count is below ~50 events, the row is suppressed entirely. The site total stays correct; the row sums don't. If you're segmenting by city + page + browser and your numbers don't reconcile, this is usually why.
Report 2: Landing Pages (Engagement > Landing page)
The page where the session started. For SEO, this is the report. Organic acquisition is about which URLs Google sent users to and what those users did next.
Two configurations to get right:
- Add Session default channel group as a secondary dimension and filter to Organic Search. Otherwise you're looking at landing pages for all traffic combined, which mixes paid landing pages, email landing pages, and organic targets into a single ranked list.
- Sort by Sessions for the volume view, Engagement rate for the quality view, and Key events for the conversion view. The same URL can rank #1 by sessions and bottom-decile by conversion. Both data points matter; neither alone tells you whether the page earns its traffic.
GA4's landing page logic is event-based, not pageview-based. The "Landing page" is the value of the page_location parameter on the first session_start event in a session. If your single-page-app setup mishandles page_view events on route changes, the landing page reported will lag the actual entry URL. SPAs that haven't updated page_view event firing for GA4 conventions show this regularly.
Report 3: Pages and screens (Engagement > Pages and screens)
Where Landing Pages tells you the entry, Pages and screens tells you everywhere users went. For SEOs, the use case is content performance broader than just the entry point — does the article you wrote drive views via internal navigation as well as via SERPs?
The metric to anchor on here is Views (which replaces UA's Pageviews). Engagement time per session is useful for content-quality benchmarking, but only when compared against pages of similar template type — comparing a long-form article's engagement time to a homepage's is meaningless.
The change-from-UA that throws SEOs the first month: there's no Bounce Rate column by default. GA4 inverts the metric — it shows Engagement rate, where a session with engagement (10+ seconds, 2+ pageviews, or a key event) counts as engaged. Bounce rate is technically still computable (1 - engagement rate), and you can add it as a column, but the inversion is intentional: Google wants you reading the positive metric, not the negative one. The 10-second threshold is the key number — it's what separates "engaged" from "bounced" in 80% of sessions. See engagement rate vs bounce rate for why this matters more than the relabeling suggests.
Report 4: Conversions (Engagement > Conversions or Key events)
GA4 renamed Conversions to Key events in mid-2024, with Conversions reserved for events linked to Google Ads. For SEO purposes, Key events are what you care about — the on-site actions that map to business outcomes (form submit, demo request, signup, purchase).
The configuration discipline:
- Mark only events that map to business outcomes. A scroll-50% event is data; it's not a key event unless your business outcome is "user read 50%." Vanity events as key events corrupt the conversion rate metric and undermine attribution comparisons later.
- Define key events at the event level, not the property level. A "demo_request" event marked as a key event will count any time it fires. A "form_submit" with parameter
form_name=demo_requestwon't, unless you also markform_submitas key — which fires on every form, including newsletter and contact, polluting the count. - Cross-reference with the Realtime report after every change. GA4's event configuration UI doesn't always reflect what's firing on the site. Verify the events you mark as key are actually being received, with the parameters you expect.
The data-thresholding gotcha here is sharp: when you segment Key events by Landing Page + Default Channel Group + Country, the long-tail rows get suppressed. Your "organic conversions by landing page" report can show 40% fewer conversions than the unfiltered total, because the filtered cuts trip the threshold. Always sanity-check against the property-level total before reporting.
Report 5: Search Console linked report (Acquisition > Search Console)
GA4 has a built-in Search Console integration that appears as a report group when you've linked the two properties. It pulls GSC's queries, landing pages, and devices, and it's the only place in GA4 where you can see Google's organic data alongside on-site behavior in one view.
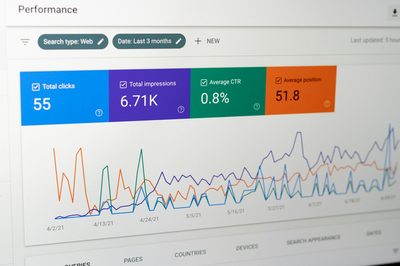
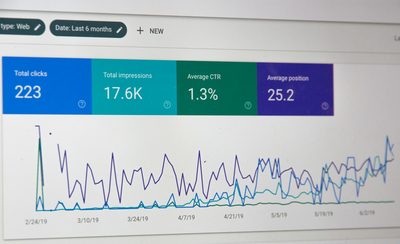
What it does well: shows top landing pages from GSC with their on-site engagement metrics next to GSC's impressions, clicks, CTR, and average position. You can spot pages that rank well, get clicks, but disengage on landing.
What it does poorly: the data is sampled to GSC's anonymized aggregates, which means long-tail queries are missing (see GSC impressions deep dive). The "average position" column from GSC is averaged across personalization and locations and is not directly comparable to a rank tracker's fixed-location number.
Worth opening weekly. Worth treating as a starting point for investigation, not the final number.
Report 6: Path Exploration (Explore > Path Exploration)
Path Exploration is one of GA4's most powerful explorations and one of the least used by SEOs. It maps actual user navigation: from the landing page, where do they go next? Does your blog article drive users to product pages, or do they bounce to your homepage and then leave?
Configuration:
- Start node = page_location for the entry URL. Pick a high-traffic landing page from Report 2.
- Step type = Page title. Easier to read than URLs in the visual.
- Filter to Organic Search at the session level. Otherwise you're mapping paths for all channels and the SEO signal gets diluted.
The output is a Sankey-style diagram. What to look for: dead ends (paths that consistently end at the entry page = no internal-link engagement), unexpected next pages (suggesting navigation or content gaps), and conversion paths (which articles route users to product or pricing).
The trap: the visualization shows the most common paths but suppresses long-tail paths under data thresholding. Unique journey patterns may not appear. Use Path Exploration for hypothesis generation, not for completeness.
Report 7: User Acquisition vs Traffic Acquisition (Acquisition > User acquisition)
GA4 distinguishes between User acquisition (the channel that first acquired the user) and Traffic acquisition (the channel that brought the session). For SEO, both matter; they answer different questions.
User acquisition tells you: how many users does organic search bring in for the first time? It's the new-user funnel for your top-of-funnel content.
Traffic acquisition tells you: of all the sessions today, how many were organic? It's the volume metric.
A user acquired via Direct (returning visitor with no UTM) but sessioned today via Organic shows in Traffic acquisition's Organic row but in User acquisition's Direct row. The difference reveals retention dynamics: if Traffic acquisition organic sessions are growing but User acquisition organic users are flat, you're getting more sessions per user — your existing audience is searching their way back, but you're not acquiring new users.
For TOFU content, user acquisition is the truer KPI. For middle/bottom-funnel content, traffic acquisition matters more.
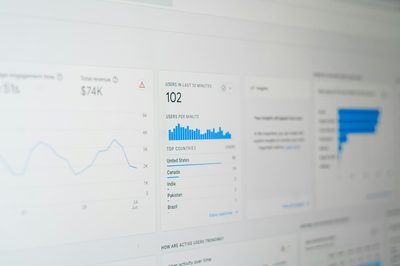
Report 8: Realtime (Realtime overview)
The Realtime report is not a strategic report. It's the operational one. Open it when you ship something — a new page, a tagging change, a tracking update — and verify that the events you expect to fire are firing, with the parameters you expect.
GA4's Realtime report has a 30-minute window and is the closest thing to instant feedback the platform offers. The Tag Assistant integration shows you the actual events being received per session, which is invaluable for debugging tagging issues in production.
The discipline: every time you deploy a tracking change, walk through the Realtime report on production with one test session. Verify the event name. Verify the parameters. Verify the user_id is set if it should be. Catch the bugs at deploy time, not three weeks later when the report you depend on shows wrong numbers.
For server-side tagging, the Realtime report is your only window into whether the server-side container is forwarding events correctly. Combined with BigQuery export for permanent storage, server-side + Realtime monitoring is the production-grade GA4 setup.
What to skip
A short list of GA4 reports that look useful but generally aren't, for SEO work:
- Demographics overview. Sampled aggressively, often suppressed entirely under thresholding, and doesn't tell you anything about search behavior.
- Tech > Browser / Device category at the property level. Useful for engineering debugging, not for SEO. The mobile-vs-desktop split that matters lives in Search Console.
- User attributes > Audiences for organic targeting. GA4 audiences are designed for Google Ads remarketing. They don't help with on-page or content decisions.
- Predictive metrics (purchase probability, churn probability). Require event volumes most SEO-driven sites don't have. Threshold for activation is 1,000 returning users with relevant events in the last 28 days.
Putting the eight together: a weekly review template
A working SEO weekly review through these reports, end to end:
- Traffic acquisition (Organic filter, 7d vs prior 7d). Is organic up, flat, or down? Investigate any move >10%.
- Landing pages (Organic filter, sort by sessions delta). Which pages drove the move? Top three pages on each side of the delta.
- Search Console linked. Are the landing-page sessions changes explained by impression or position changes upstream?
- Conversions / Key events. Did the session changes translate to conversion changes? Conversion-rate stable means quality is intact; conversion-rate drop on stable sessions is a quality problem.
- Pages and screens for the affected URLs. Engagement time per session and views per user for the moving pages.
- Path Exploration on the top mover. Where did the new sessions go after landing? Did they progress to mid-funnel content or bounce?
- Realtime sanity check. Are events still firing correctly today?
Forty minutes a week. Tells you the state of organic with enough specificity to brief your CMO without spin.
For the corresponding view from Google's side of the SERP, GSC impressions deep dive covers how to read the upstream signal honestly.
Frequently asked questions
Why don't my GA4 organic sessions match GSC clicks?
They never match. GSC clicks are logged on Google's SERP click-out events; GA4 sessions are logged on landing on your site. The gap is bots that don't run JS, users who clicked then bounced before GA4's tag fired, and ad-blocking. A 10-25% gap is normal; a 50%+ gap means a tagging or referrer-classification problem.
Should I use Explorations or pre-built reports?
Pre-built for stable, recurring views. Explorations for one-off investigations. Explorations don't share well across teammates and have row limits that bite at scale. If you find yourself rebuilding the same Exploration weekly, promote it to a saved Library report.
What's GA4's session timeout, and can I change it?
Default is 30 minutes of inactivity. Configurable in Admin > Property Settings > Data Streams > Configure tag settings. For most SEO use cases, leave it at 30 minutes — changing it makes session counts incomparable to industry benchmarks.
How do I track organic conversions when users convert across multiple sessions?
GA4's default attribution is data-driven (or last-click for Ads). For organic specifically, the cross-session credit lives in the Attribution reports under Advertising > Attribution. See attribution models for SEO for which model to actually use and why.
Do I need BigQuery export to use GA4 effectively for SEO?
For sites doing under 1M sessions/month, no. BigQuery becomes essential when you need data beyond GA4's 14-month retention default, custom analyses that hit Exploration row limits, or cross-property joins. Free tier is 10 GB storage, 1 TB query/month — fits most mid-market sites comfortably.
Related articles
Attribution Models for SEO: Pick the One That Doesn't Lie
Last-click hides the work SEO does. First-click hides the work everyone else does. Here's how to pick an attribution model that survives a real audit.
Cohort Analysis for SEO: Beyond Vanity Trends
Site-wide traffic charts hide the real story. Group landing pages by acquisition month and you'll see which content compounds, which decays, and where to refresh — with concrete spreadsheet steps.
The SEO Analytics Stack: GSC, GA4, and What Else Matters
GA4 confused everybody. GSC stayed honest. Third-party tools fill specific gaps. Here is the full SEO measurement stack — data sources, attribution, KPI tree, dashboards — without the vendor pitch.