The SEO Analytics Stack: GSC, GA4, and What Else Matters
A measurement framework that survives audit, board questions, and the next platform change

GA4 confused everybody. Google Search Console stayed honest. Third-party tools fill specific gaps that neither covers. That sentence is the whole map of SEO measurement in 2026, and most stacks you will inherit got at least one part of it wrong.
The mistake usually looks the same. A team sets up GA4 in 2023, panics about thresholding and sessionization changes, and falls back on rank trackers as the "real" number. Or it pipes GSC into a dashboard, declares impressions the north star, and wonders why nobody on the executive team cares. Or it buys an enterprise platform that bundles ten data sources and produces a 38-tab dashboard that nobody opens.
This pillar is the framework I use to design SEO measurement stacks that survive a CFO's questions, a Google update, and the next time a vendor changes its definition of "share of voice." It covers the four data sources that matter, the attribution model that doesn't lie, the KPI tree from revenue down to coverage, and the dashboards that get read. The 12 satellites in this cluster go one level deeper on each piece — link-outs are inline.
The four data sources that actually matter
Most SEO stacks pull from too many places. The signal lives in four sources, and any tool you buy is a wrapper around one of them.
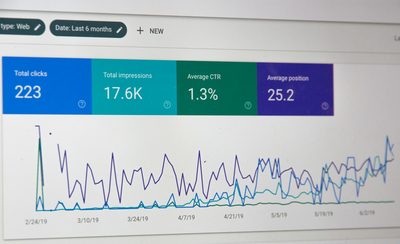
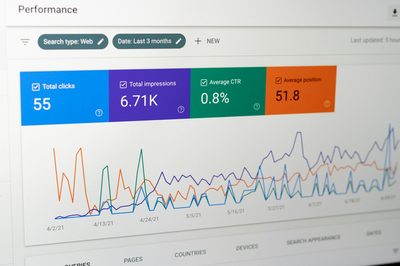
Google Search Console is your only first-party view of what Google actually indexes and serves. Impressions, click-through rate, average position, and the Page Indexing report. GSC is anonymized below threshold, lags 24-48 hours, and rounds aggressively, but the numbers it does give you are ground truth. No competitor estimation, no extrapolation. The GSC impressions deep dive covers what the metric counts and what it omits.
GA4 is your only first-party view of what users do after the click. Sessions, engagement rate, conversion rate, revenue. GA4 deprecated Universal Analytics on July 1, 2023, broke a lot of historical comparisons, and introduced data thresholding that kicks in below roughly 50 events for protected dimensions. The GA4 for SEO reports guide lists the eight reports that matter and the ones that mislead.
Server log files are your only view of what crawlers actually do. Googlebot request rate, crawl waste, response codes per URL pattern. GSC's Crawl Stats samples; logs are per-URL truth. If you run a site over 100k URLs without log access, you are guessing. The technical SEO pillar covers how logs fit the broader audit.
Third-party rank trackers, share-of-voice tools, and AI-visibility platforms fill three gaps GSC cannot: ranking position fixed to a single location/device, share of voice across a defined keyword universe, and brand mention rate inside LLM answers. They are estimates, vendor-specific, and disagree with each other. Use them for trend, not for absolute numbers.
Anything beyond these four — heatmaps, session replays, BI overlays — is a downstream consumer of the same upstream data. Get the four right first.
Why GA4 confused everybody (and how to recover)
GA4 changed three things at once: the data model, the attribution model, and the privacy floor. Each one alone would have been disruptive; together, they broke the muscle memory of every SEO team that grew up on Universal Analytics.
The session model changed. UA sessions ended at 30 minutes of inactivity or at midnight; GA4 sessions end at 30 minutes of inactivity but ignore the midnight cutoff. A user who reads your article at 11:55 PM and clicks again at 12:05 AM was two UA sessions and is one GA4 session. Year-over-year session counts dropped 5-15% on most sites for this reason alone.
The engagement metric replaced bounce rate. UA's bounce rate measured "single page sessions"; GA4's engagement rate measures sessions over 10 seconds, with a conversion event, or with two pageviews. The inversion ("low bounce good" became "high engagement good") confused dashboards for two years. The engagement rate vs bounce rate satellite walks through the threshold and why it misleads as a standalone SEO metric.
Data thresholding hides small numbers. When a query, page, or audience produces fewer than roughly 50 events for a protected dimension (especially Google Signals demographics), GA4 silently zeroes it. Long-tail SEO pages are the most affected. You see "0 conversions" on a page that converted 3 users, because 3 falls below threshold.
Recovery is process, not configuration. Pick a small number of GA4 metrics you trust (sessions by landing page, conversion events you defined yourself, revenue), instrument them server-side where possible, and stop chasing parity with UA. Your 2022 numbers are gone. The organic conversion tracking satellite covers the server-side path and the events worth defining.
Why GSC stayed honest
GSC's reports are dull, slow, and limited. That is exactly why they are the most reliable layer of your stack.
GSC does four things well. It tells you which queries triggered an impression for your pages over the last 16 months. It tells you which pages Google indexed, which it skipped, and roughly why. It tells you Googlebot's crawl behavior in aggregate. It tells you when Google detects a manual action against your site. None of those numbers are estimated, modeled, or extrapolated by a third party.
GSC's well-known limits are honest about themselves. Anonymization removes queries with very low volume — you will never see the exact query for a single-impression long-tail. The 1,000-row API limit per request is real; the BigQuery export, available since February 2023, removes it for sites that need full coverage. The average position metric averages across personalization, location, and device — which is why it disagrees with a fixed-location rank tracker. The GSC vs rank trackers satellite covers when the disagreement is signal and when it is noise.
What GSC will not give you: post-click behavior (use GA4), real revenue (use GA4 + your commerce backend), competitive context (use a third-party tool), or mention/citation rate inside AI answers (use an AI-visibility tool). Stop demanding those numbers from GSC and you will trust the numbers it does give.
The attribution decision: pick one that does not lie about SEO
Attribution is where SEO measurement quietly fails. The default last-click model under-credits SEO, because users typically discover your brand through organic search and convert via direct or branded paid weeks later. First-click over-credits SEO for the same reason in reverse. Data-driven attribution sounds objective but depends on a black-box model you cannot audit.
For SEO-specific reporting, the position-based model (40% first interaction, 40% last interaction, 20% middle) tells the least-misleading story most of the time. It honors the discovery role of organic traffic without pretending that organic single-handedly closed the sale. The attribution models satellite walks through the four models GA4 still exposes (after deprecating most others in 2023) and the case for position-based.
Three rules for attribution sanity:
Pick one model and stick to it for at least four quarters. Switching models mid-year invalidates trend analysis and lets every team blame the model when their numbers drop.
Document the model choice in your dashboard. Future stakeholders will ask. "Position-based, GA4 default, since Q3 2024" is a one-line answer that prevents quarterly arguments.
Cross-check with last-click as a sanity floor. If your position-based revenue claim is 4x your last-click claim, something is wrong with your event definitions or your channel grouping.
The KPI tree: from revenue down to coverage
A working SEO dashboard is a tree. Revenue at the top, coverage at the bottom, and every layer in between has a clear cause-effect relationship with the layer above it. When the top moves, you walk the tree until you find which layer broke.
The tree, simplified:
Revenue (or pipeline, MRR, leads — whatever your business actually sells) ↓ Conversions from organic (with the attribution model you committed to) ↓ Sessions from organic (filtered to the channel grouping you trust) ↓ Clicks from Google (cross-validated with GSC) ↓ Impressions (your visibility, before any CTR effect) ↓ Average position + indexed page count (the supply-side levers) ↓ Crawl + index coverage (what Google can even see)
Every layer is a multiplication. Revenue equals conversions times average order value. Conversions equal sessions times conversion rate. Sessions equal clicks times any onsite redirect/decay losses. Clicks equal impressions times CTR. Impressions equal indexed pages times queries served times rank distribution. Coverage gates everything above it.
When a quarterly review shows revenue down 8%, you do not argue about it; you walk the tree. If conversions held but sessions dropped, the click side broke. If clicks held but conversions dropped, the post-click experience broke. If impressions dropped while position held, your indexed page count fell. The SEO KPI tree satellite goes deeper on the diagnostic flow.
The tree also disciplines vanity. Share of voice and organic visibility sit beside the tree, not inside it. They are competitive context, not financial outcomes. Report them, but never let them substitute for the trunk.
Dashboard architecture: three layers, three audiences
One dashboard cannot serve a CFO, a head of marketing, and an SEO IC. Build three, each tied to the same KPI tree but cut at a different altitude.
Executive layer. Revenue from organic, quarter-over-quarter. Conversion count and conversion rate trend. One competitive metric (share of voice or organic visibility, your choice). One risk metric (Page Indexing state distribution from GSC). Four to six numbers, no more. The reporting to non-SEO stakeholders satellite covers what to never include in a board deck.
Marketing leadership layer. All executive numbers plus: top 20 landing pages by revenue, top 20 queries by clicks, conversion rate by content cluster, TOFU/MOFU/BOFU split. Cohort comparisons by acquisition month. Roughly 20-30 numbers, weekly cadence.
SEO operator layer. Everything in the marketing layer plus: GSC impression and CTR by query class, indexed-versus-published delta, Core Web Vitals field data by template, log-file crawl distribution, rank-tracker data per priority keyword, AI-visibility tracker if you run one. This is the working dashboard, refreshed daily, that drives the next sprint.
The trap is building only the operator layer and assuming the executive can read it. They will not. Build the executive layer first, then derive the others.
Choosing third-party tools without the vendor pitch
Third-party SEO tools fill gaps GSC and GA4 cannot. They are also where most SEO budget gets wasted on overlapping features.
The decision frame I use:
Rank tracking if you need fixed-location, fixed-device ranking for a defined keyword set. GSC's average position is useless for "did we rank #3 in Madrid on mobile last Tuesday." Any tracker that polls daily and lets you set device + location works; the differences are dashboard quality, not data quality.
Share-of-voice tools (Ahrefs, Semrush, Sistrix, SE Ranking) if you need competitive ranking context across thousands of keywords. The estimation methodologies differ — the share of voice tracking satellite covers why two tools can show 30% disagreement on the same site. Pick one, document the methodology, and never quote a multi-tool composite.
Log-file analyzers (Screaming Frog Log File Analyser, Botify, Oncrawl) if your site exceeds 100k URLs. Below that threshold, GSC's Crawl Stats is enough.
AI-visibility trackers (Profound, Otterly, Athena, Goodie) if you care about brand mentions in ChatGPT, Perplexity, Claude, and Google AI Overviews. The category is two years old, methodologies are immature, and the tools disagree more than rank trackers ever did. The GEO pillar covers when this category is worth paying for and when it is not yet.
Skip any tool that bundles "all-in-one SEO suite." You are paying for features you can get free in GSC plus features that overlap your other paid tools.
The five pitfalls that mislead boards
Five mistakes I see consistently — most of them survive multiple SEO leadership changes because nobody questions them.
Reporting impressions as a north star. Impressions inflate when AI Overviews fire, when Google rolls out new SERP features, or when your queries shift toward longer tail. Up-and-to-the-right impression charts can mask falling clicks and falling revenue. Always pair impressions with click trend and CTR.
Confusing GA4 sessions with UA sessions in year-over-year reporting. The 2023 cutover broke the comparison. If your 2024 sessions are down 12%, check the cutover before declaring an SEO regression.
Pairing share-of-voice trends across vendor switches. You changed from Semrush to Ahrefs in February. Your "share of voice" jumped 18%. That is methodology, not performance. Document tool changes and never compare across them.
Using UTM parameters on internal organic links. This breaks GA4 channel grouping; users who arrive on a UTM-tagged internal link get re-attributed to the campaign in the UTM, not to organic. The UTM hygiene satellite covers when to tag and when to stop.
Quoting ROI without a methodology line. "SEO ROI is 8.4x" means nothing without the cost basis (just SEO salaries? content production? technical infra?), the attribution model, and the time window. The ROI for SEO satellite walks through the three calculation models and the one that survives finance scrutiny.
A sixth, less common but expensive: never report a metric you cannot reproduce in 60 seconds. If your monthly board number requires three pivot tables and a vendor login, it will eventually be wrong, and you will not catch it.
Cohort analysis: the trend most SEO teams skip
Most SEO dashboards report monthly aggregates. That hides the most important question: does your content compound, or does it decay? The only way to see the answer is cohort analysis.
The basic move: group landing pages by the month they were published. Track sessions and conversions per page over the next 12 months. Pillar content typically peaks 4-9 months post-publication and holds. Satellite content peaks 2-4 months post-publication and decays unless updated. Newsletter-style content peaks within 30 days and never recovers.
The cohort view tells you whether your content strategy actually works. A growing flat cohort line means the new content is replacing decayed traffic but not adding to it. A growing rising line means content compounds. The cohort analysis satellite covers the cohort cuts that matter and the freshness signal you can extract from them.
Run cohorts at least quarterly. They are the only metric that distinguishes a content team that is winning from one that is on a treadmill.
Putting the stack together
A working SEO measurement stack in 2026 looks like this. GSC piped into BigQuery for the queries the API limits you on. GA4 with server-side conversion tracking and a position-based attribution model. Server logs sampled weekly if you exceed 100k URLs. One rank tracker, one share-of-voice tool, one AI-visibility tracker if your category warrants it. Three dashboards, executive on top, operator on the bottom. A documented KPI tree that everybody references when numbers move.
The supporting articles in this cluster go one level deeper on each piece. The GA4 for SEO reports guide covers the eight reports worth pinning. The GSC impressions deep dive walks through what impressions actually count. The attribution models satellite covers the model selection. The KPI tree satellite covers the diagnostic walk. The GSC vs rank trackers satellite covers the position-disagreement question. The share of voice tracking satellite covers vendor methodology differences. The organic conversions in GA4 satellite covers server-side and event design. The UTM hygiene satellite covers when not to tag. The reporting to stakeholders satellite covers the translation problem. The cohort analysis satellite covers compounding-versus-decay. The engagement rate vs bounce rate satellite covers the GA4 inversion. The ROI for SEO satellite covers the calculation models.
For external references, Google's own GA4 documentation and the GSC help center remain the best primary sources. Read them once a quarter; both products change.
How to apply this Monday morning
If you inherited an SEO measurement stack and you are not sure where to start, do four things this week.
Open GSC's Page Indexing report. Note the absolute count in each state. That is your coverage layer baseline.
Open GA4's Acquisition > Traffic Acquisition report. Filter to organic search. Note sessions, engagement rate, and conversion count for the trailing 28 days. That is your sessions and conversions layer baseline.
Document your current attribution model. If you do not know what it is, GA4's default is data-driven; that is what your reports are using. Decide whether to keep it or switch to position-based, and write the decision down.
Sketch the executive dashboard on paper. Six numbers maximum. If you cannot get to six, you have not picked your KPIs yet.
Two hours, four artifacts, a working baseline. Everything else in this cluster builds on those four.
The teams that win at SEO measurement are not the ones with the most tools. They are the ones who pick a small number of metrics they trust, defend them across vendor changes and platform churn, and walk the KPI tree the same way every quarter. Build that discipline once and the next platform change — there will be one — costs you a week, not a year.
Ready to instrument your stack? Start with the GSC impressions deep dive if your coverage layer is the gap, or the KPI tree satellite if you need the diagnostic flow first.
Related articles
Cohort Analysis for SEO: Beyond Vanity Trends
Site-wide traffic charts hide the real story. Group landing pages by acquisition month and you'll see which content compounds, which decays, and where to refresh — with concrete spreadsheet steps.

Engagement Rate vs Bounce Rate: What Changed in GA4
Bounce rate inverted in GA4 and most teams still report it the old way. Here's what 'engaged session' really means, the 10-second threshold, and why engagement rate alone misleads SEO decisions.
Attribution Models for SEO: Pick the One That Doesn't Lie
Last-click hides the work SEO does. First-click hides the work everyone else does. Here's how to pick an attribution model that survives a real audit.